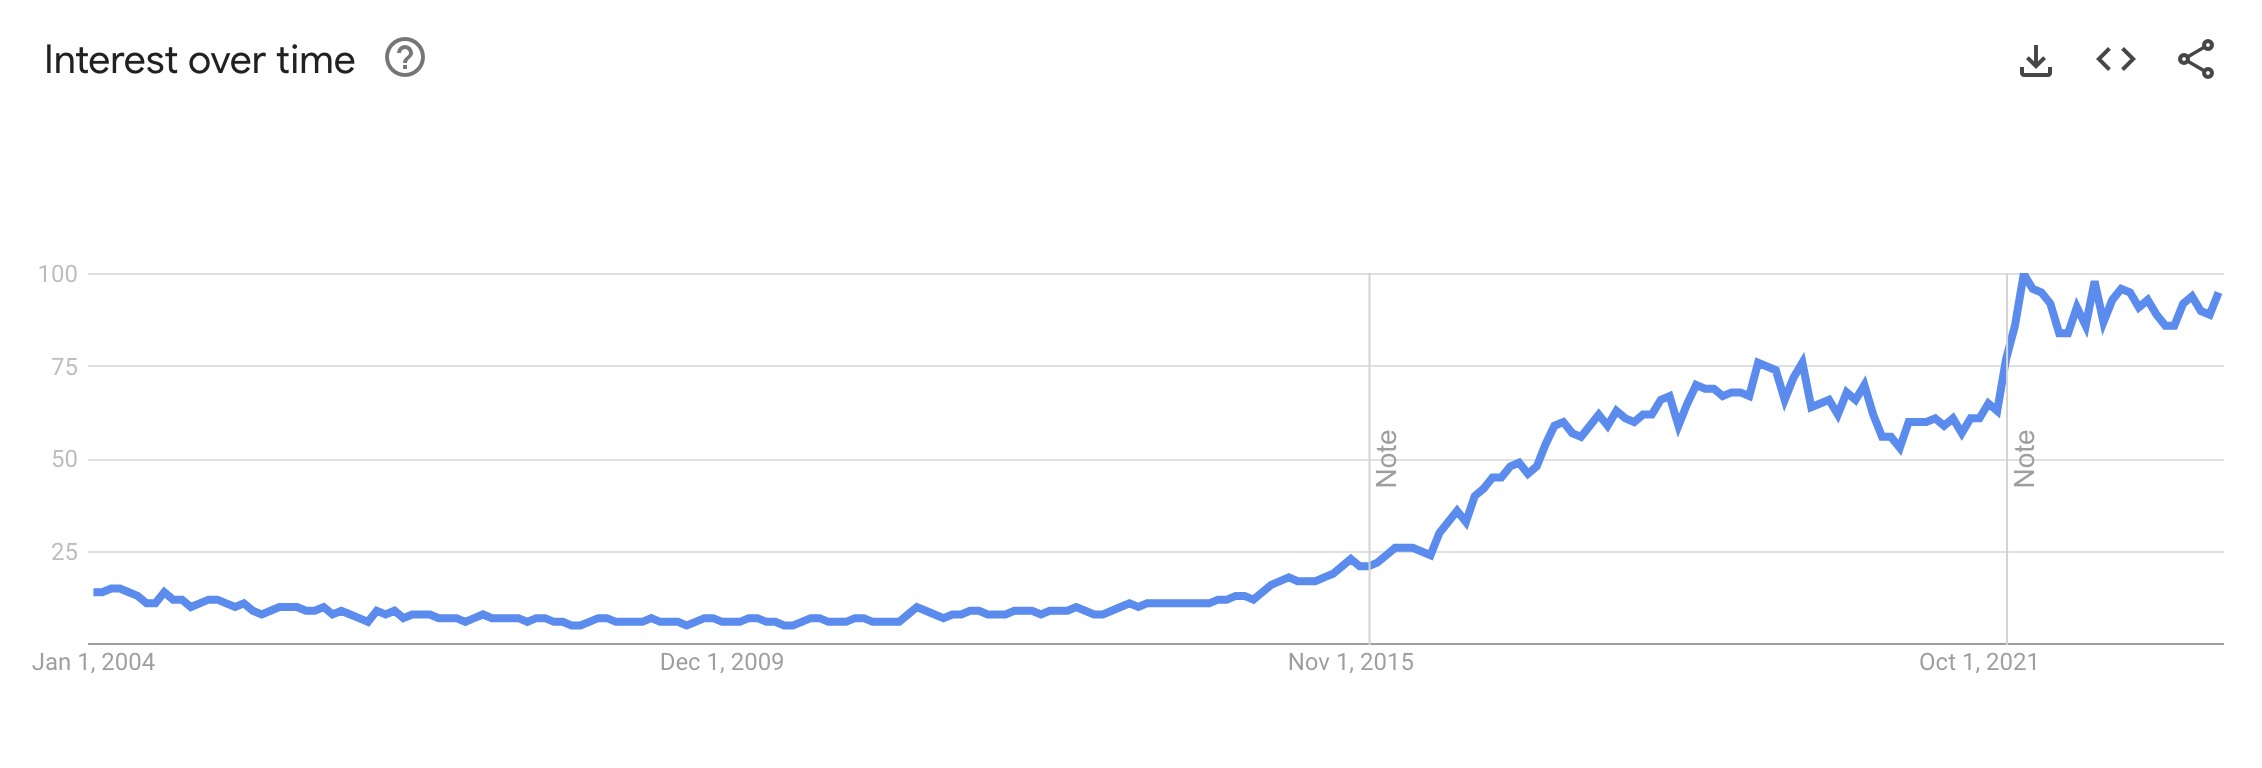
Ever since late 2022, when ChatGPT first came out, we’ve seen an immense increase in public discussion regarding machine learning and its applications. But it’s been steadily gaining traction even before that!
So let’s assume you’re an undergraduate computer science student with spare time on your hands, and you want to try your hand at machine learning!
What do you want to work on?
At its core, machine learning is just an umbrella term for a variety of tools. These tools are most commonly known for being very good at handling a large quantity of data, but in recent years there’s been research into optimizing them for sparser quantities of data as well. But that means you should have a task for which you’re applying these machine learning tools.
To borrow some ideas from the University of Toronto Student Machine Intelligence Student Team’s past and current projects: do you want to learn about the stock market? Do you want help in picking an outfit every day? Do you want to be able to create cool music? There are different kinds of applications of machine learning to various types of problems. Pick something you’re interested in!
What has already been explored?
Of course, there are lots of domains that other people have already explored! In most cases, that’s to your benefit. That means you can learn from what other people have already tried, and think about how you can improve on those results. What might you be able to change to produce a different result?
Also, if there isn’t a particular topic that you want to work on just yet, another person’s project might just speak to you! We’ll talk more about these resources in the data section, but there are loads of data sets and machine-learning challenges that you might want to try your hand at. Kaggle competitions are a popular one; another example might be the Radiology Society of North America’s AI challenges if you’re interested in radiology. Papers with code is another resource for others’ work with open-access code.
So don’t get discouraged if you think something has already been worked on; that just means there’s all the more for you to learn!
Gathering data
Now that you’ve got a general idea of what you want to look into, every machine learning project needs data. This is generally because the domain you’re trying to learn is vast and multi-dimensional, so the more data you have, the closer to an approximation you can make.
As linked above, the RSNA and Kaggle websites will provide you with data. If you’re interested in natural language processing tasks, datasets such as those found on Common Crawl may be helpful. As a personal plug, EMILI is a project that I’ve been working on to help scrape and create domain-specific language models. ImageNet is one of the largest datasets for imaging tasks.
Sometimes you’ll also need to collect your own data if no dataset exists exactly as you wanted. But beware! A “lot” of data is just that… a 2023 competition for building language models on a “small” dataset, BabyLM, considered “small” to be around 100 million words.
Why do you need good data?
You might have heard the phrase, “Garbage in, garbage out”.
Something to consider when gathering your data or datasets is what exactly it includes and how it is organized. For most of the machine-learning projects I’ve worked on, I spent the majority of the time working with the data.
If you’re working with text from the internet, are there ads in the middle of the text? Are there links? Is everything formatted normally, or are some parts oddly spaced or capitalized? Are there escape sequences left in? If you’re working with physical data, such as clinical data, are all the units the same across your values? What kinds of ranges do they have, and is that normal? If there are multiple tables, have you connected them properly? If you’re looking at MRI scans, for example, are they all of the same type of scan – I recently learned that there are multiple types?
And that’s not even including testing that the data you’re using for your project is actually what you want; if you want data from a particular demographic, have you filtered out the unnecessary information properly so as to not bias your study with noise? Moreover, if you’re doing a study on the correlation between features, have you included all possible covariates that could affect your outcome? A course that I found great on the topic was Miguel Hernan’s course on causal inference.
Of course, the importance of these steps depends on the purpose of your project as well as its scope, but it’s important to know exactly what kind of data you’re feeding a model to properly understand its results.
Now, no data is perfect. Sometimes you will just have to suck it up and make do with what you can get your hands on. But at the very least, understanding where the gaps lie in your data could help inform you on the performance and understanding of your analysis. And if it’s really that difficult to make do with anything, maybe you can set your sights on gathering that high-quality data – after all, someone has to do it, right?
Modelling the Data
Now that you have all this data, what do you do with it?
There are definitely some preferences depending on the data type – for example, if you are working with images, you might immediately jump to a Convolutional Neural Network. And there are definitely popular trends as well, such as the rise of transformer models.
You also don’t have to do everything from scratch yourself; consider pre-trained models (e.g., Kaggle, HuggingFace) or various APIs (e.g., Cohere). Regardless of how you’re approaching your problem domain, a common programming language to use is Python, for its many machine learning- and data science-related packages (e.g., PyTorch, Tensorflow, NumPy, Scikit Learn, OpenCV, among others).
Presuming you’re not using a pre-trained model, one thing to consider is what assumptions you’re making about your data and the general level of complexity that you’d like. Simple neural networks, linear and logistic regression, are some examples of parametric models. There is a fixed number of parameters and a set of assumptions that the model operates on. This can be useful for constructing a simpler model and therefore requiring less data in order to fit the model. However, you could run into issues if you have a lot of noisy data or if the assumptions you’re making aren’t quite correct. Non-parametric models, on the other hand, include other common models like k-nearest neighbours or decision trees, which may be useful if there is little prior knowledge about your data or topic.
Another thing to consider is the type of data. For example, if you’re dealing with financial data, where events happen over a period of time, you may want to consider models like Recurrent Neural Networks (RNNs) or Long Short-Term Memory (LSTM) for your purpose. There’s no perfect one-size-fits-all solution, but there are lots of options out there which means great flexibility. As such, I won’t say too much more on the matter, but check out Other Resources for other articles on model selection!
Compute power…?!
Running complicated jobs can be very difficult if you don’t have access to a high-end computer or GPU nodes, depending on your goals. If you don’t have access to an external computing cluster such as Compute Canada, there are some other paid options. Google Colab has both free and paid GPU access. Another (paid) option could be Paper Space.
And if you’re doing a project with UTMIST, there are some options there too!
Graphs, Analysis, and so on
Now that you have (preliminary) results, it is time for you to look at the results.
One common way to do so is by generating a graph to visualize the results. If you’re looking for inspiration on different kinds of graphs, the R Graph Gallery is a great resource for creating different kinds of graphs using the tidyverse package in R. Of course, many graphs can also be constructed using various libraries in Python, such as matplotlib or bokeh. This can be useful in situations where you’re modelling the relationship between different variables.
But maybe your data is a bit too complex to properly visualize in a 2D (or even 3D fashion). For example, if you’re classifying textual data, your embeddings may have too many dimensions. That’s when dimensionality reduction techniques such as Principal Component Analysis (PCA) come into play.
What if you’re training a model for a specific task, like answering domain-specific questions or solving math problems? Graphing your results might not be too useful. A common approach is to compare your model against benchmarks. You can do this by picking a pre-existing model that specializes in a similar domain as yours or a foundation model like ChatGPT. You can construct your own dataset to do the comparison – for generative language models, that might be a set of questions and desired answers – or use pre-existing benchmarks. Some examples include Multi-task Language Understanding on MMLU, General Language Understanding Evaluation, and Stanford Question Answering Dataset, although these are all for natural language processing problems.
Conclusion
This is all to say, machine learning is a very broad topic with many different applications. The exact procedure of your project will wildly differ depending on the topic and type of data, but hopefully, this guide provides some relevant links and inspiration for getting started on your own project!
Other Resources
Here are some other resources, in case you’d like to check them out:
- Andrew Ng is known for explaining ML concepts well
- An article on model selection
- An article on Occam’s Razor and model selection
- A blog that discusses statistical analyses among other topics
- DataPerf tries to evaluate your training dataset
- Some people on Reddit tried creating a machine learning-focused version of Leetcode: see here and here